Checking Access Log Files
[link—standalone]
From time to time you need to check the access log of some of your servers
right? Sometimes you want to find if or why something is wrong and sometimes you
just want to gather some data (to understand if or why something is
wrong).
Here are some neat tools and commands I use to check the access log files of my
servers.
goaccess
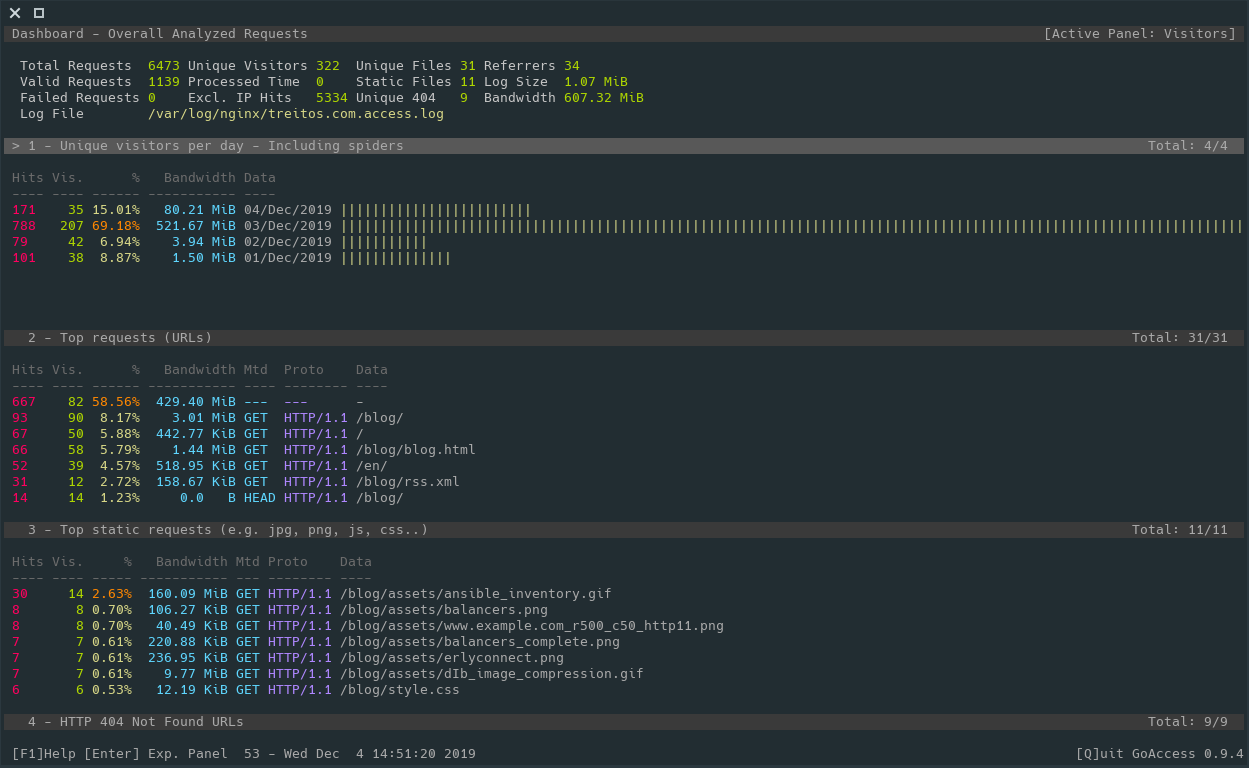
I love console based and pretty looking tools and for sure goaccess is one of those.
This tool allows you to see what is going on in your website giving you some
stats and some information about your visitors. There you can see what are
the most requested urls, the amount of visitors per day, the hours where you
get more traffic, referrers, etc.
You can run it with
goaccess -f /var/log/nginx/access.log
And it basically looks like this:
However it also provides an HTML interface so you can periodically generate
a static HTML page to check the stats in an more graphical format.
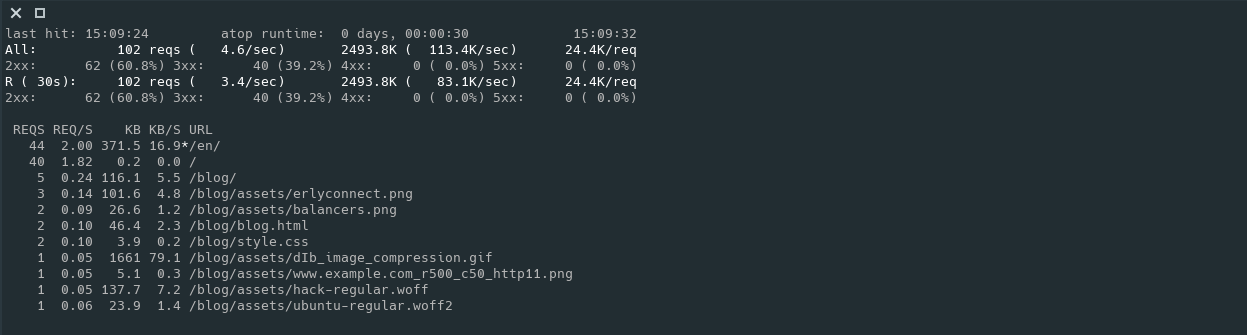
apachetop
The name says it all: it is a top command for apache. However, as it
requires an access.log file as input, you can also use it with nginx as
long as you keep the common log format.
One of the features that I like about this command is that it will show the
current rate of requests per second, averaging both since the command
started and in an specified interval (default 30s). It will also show the
most requested urls and other stats.
You can run it with
apachetop -f /var/log/nginx/access.log
And it looks like this:
grep
Yes... grep and friends help me a lot to find useful information and stats.
Let me show you some examples.
$ zgrep -Poh '" \d{3} ' access.log* | sort | uniq -c | sort -rn

196071 " 200
 30397 " 302
  3928 " 404
   590 " 301
   339 " 304
    48 " 502
    38 " 470
    32 " 499
    27 " 504
    24 " 500
    18 " 400
     9 " 418
     4 " 405
     2 " 206
     1 " 403
$ zgrep -Poh '\d{2}/Nov/2019' access.log* | sort | uniq -c
[ ... ]
1601 21/Nov/2019
1603 22/Nov/2019
1552 23/Nov/2019
1517 24/Nov/2019
1601 25/Nov/2019
1545 26/Nov/2019
1624 27/Nov/2019
1615 28/Nov/2019
1542 29/Nov/2019
1527 30/Nov/2019
$ zgrep -Poh '03/Dec/2019:\d{2}' access.log* | cut -d' ' -f1 | sort | uniq -c
  63 03/Dec/2019:00
  66 03/Dec/2019:01
  61 03/Dec/2019:02
  64 03/Dec/2019:03
  62 03/Dec/2019:04
  65 03/Dec/2019:05
  61 03/Dec/2019:06
  60 03/Dec/2019:07
  73 03/Dec/2019:08
  73 03/Dec/2019:09
  73 03/Dec/2019:10
  64 03/Dec/2019:11
 164 03/Dec/2019:12
 137 03/Dec/2019:13
 135 03/Dec/2019:14
  93 03/Dec/2019:15
 103 03/Dec/2019:16
 195 03/Dec/2019:17
 145 03/Dec/2019:18
 139 03/Dec/2019:19
  94 03/Dec/2019:20
 114 03/Dec/2019:21
 109 03/Dec/2019:22
 106 03/Dec/2019:23
$ zgrep -Poh '.* \[03/Dec/2019.*\] "HEAD ' access.log* | cut -d' ' -f1 | sort | uniq -c | sort -rn
4 54.209.251.246
3 35.247.113.5
3 217.182.175.162
2 3.82.218.185
2 35.230.122.175
2 34.83.11.15
1 96.28.180.117
1 95.216.13.24
1 94.130.53.35
1 91.121.79.122
1 69.113.35.243
1 51.91.13.105
I know what you are thinking: "This guy has no traffic at all" ... and you are
right. This server has almost not traffic.
Jokes aside, I hope you can see that you can make different combinations of the
above commands, or change some parameters to obtain the information you are
looking for in a very easy way.
ansible -o -m shell -a "zgrep -h  '\"GET /public/awesome_85.03.img' /var/log/nginx/public.access.log* | egrep 'ROUTERCOM' | grep '\" 200' | egrep '/Nov/2019' | awk '{ print \$1\" \"\$9 }' | sort | uniq | wc -l" 'frontends:!TRASH' | awk '{sum += $8} END {print sum}'
217
This is based in a real case. It looks in all the frontends servers defined
in the Ansible inventory (that are not in the TRASH group) for successfull
downloads (code 200) using the user agent "ROUTERCOM" during November 2019
of the firmware awesome_85.03.img and then gets the output from ansible and
sums all the values, returning single number of downloads: 217.