Blog 2019
Linux Smart Enumeration 1.15
[link—standalone]
In the past days, there were a lot of improvements in the Linux Smart Enumeration
script. Some of them were related to stability but most of them addressed
some performance issues in certain scenarios.
Thanks to an issue opened last week (thanks @exploide) I started to
investigate a serious performance problem that occurs when the user
executing the script has thousands of writable files outside its home
directory. In this case, LSE could take hours to finish do to how several
checks were performed.
After some testing, I found some good alternatives to write the problematic
tests and I ended up shorting the time (in my environment) from hours to
8 minutes.
In addition, I implemented a new option that allows the user to exclude
paths from the tests. So if you know that the machine you are testing has a
ton of files under, lets say, /mnt/backups, now you can use -e /mnt/backups so tests will skip that path. You can also specify several
paths in a comma separated list: -e '/mnt/backups,/var/lib/mysql'.
After using this option in my environment, I improved the timing from the
past 8 minutes to just 2 minutes while excluding a path with thousands of
writable files for the user.
Of course, using the -e option will give less complete results, so use it
with care.
A bit more about the problem
Several tests use the files found in test fst000 (writable files outside
home directory) to find interesting files. For that they iterate over these
writable files.
The problem was that in each iteration, the tests made some basic checks like,
before doing anything, confirm that the file exists with [ -f "$w_file" ].
This apparently innocent call worked just fine in systems with a few hundreds of
writable files found, but when several thousands are found, then this call hits
really hard, performance wise.
The solution was to work only with the path strings until we have a positive
match for the specific test and only then check if the file exists. Now it seems
pretty obvious :).
Happy Hacking!
Fri, 20 Dec 2019 12:31Drupal Security
[link—standalone]
The last couple of years have been hard for the Drupal team, with several
highly critical vulnerabilities in the Drupal Core. First it came
SA-CORE-2018-002 in March 2018,
which was commonly known as drupalgeddon2. Not even a month later we had
another round with SA-CORE-2018-4.
After some other critical vulnerabilities we found another highly
critical at the begining of this year: SA-CORE-2019-003.
Yesterday, we had a batch of critical and moderately critical updates
that you should patch as soon as you can. It is in these cases where you are
glad to be running some sort of WAF
that creates an additional layer of protection against attacks.
Drupal vs Wordpress security
One might think that after seeing these Drupal vulnerabilities published it
would be better off using Wordpress. After all, you don't see any security
advisory from Wordpress. How is that possible? Because Wordpress does not
any kind of differentiation between regular and security updates. That means
that you don't know if the next update is "highly critical" or just a "minor
fix" so you cannot plan accordingly. Updating software always risks to break
something so many follow the rule: if it works, don't touch it. However, this
rule falls appart when the security of your site and users is at stake, so you
better know if it works safely.
Besides that, Wordpress does not have a security advisory page where to
publish the security updates like Drupal has.
Drupal even has one for its
contributed projects. For Wordpress you have to rely on a third party service
like wpvulndb that, althought it is awesome, it is
a shame that a basic service like this is not offered by Wordpress itself.
Thanks to this control over updates and security, the Drupal admin panel will
show the user when security updates are pending and it will let you know very
clear that they should be applied as soon as possible.
So if you hear more about Drupal than Wordpress security problems is, in part,
because the Drupal team has way more control over their security. For this
reason I think Drupal is better at securing their software than Wordpress is.
Thu, 19 Dec 2019 12:37Nginx Cache Purge
[link—standalone]
For a while I've been looking for a proper solution to purge the cache of one or
several entries in my nginx servers.
The solutions I found were either the commercial ones
or some lua modules that didn't look very solid and actually had some security
vulnerabilities.
I know that there are projects like ngx_cache_purge,
which is even packaged for the official debian repositories, but it does not
allow the use of wild cards to purge cache entries.
I already had my own solution using some trickery with cache_bypass to be
able to clear the cache of a single URL, but I wanted more.
As I already had some experience with ngx_lua from my nginx_waf module,
I decided to create my own lua module to purge caches that allows me to
purge both single and multiple entries. It is also easy to deploy and
very versatile in the ways you can set it up.
It can work very similar to the commercial solution but of course the
performance will be a bit worse and it is for sure not as elegant.
Performance shouldn't be a big issue when clearing caches, but I did the best I
could to improve response times in balance with setup easiness and versatility.
In any case it gets the job done with a reasonable performance and security.
Please check it up here: https://github.com/diego-treitos/nginx_cache_multipurge.
Wed, 11 Dec 2019 17:46Quick temporal VPN
[link—standalone]
Sometimes I need to access an internal network or server where a customer hosts
their services. This internal network is usually behind some firewall that
allows generally unrestricted outgoing traffic but blocks incoming connections
or lacks of any NAT configuration.
It would look something like this.
INTERNET           ║             LAN
                   ║
                   ║
                ╭──╨───╮      ╭───────╮
             ◀──┤router├────┬─┤server1│
                ╰──╥───╯    │ ╰───────╯
                   ║        │
                   ║        │ ╭───────╮
                   ║        ├─┤server2│
                   ║        │ ╰───────╯
                   ║        │
                   ║        │ ╭───────╮
                   ║        ╰─┤server3│
                   ║          ╰───────╯
                   ║
In these cases, you need some setup that allows you to connect to these servers
and that is simple, mostly on the customer side. Ideally allowing a
non-technical person on the client side to follow just a couple of easy steps.
Solution
You need a server with a public IP. If you already have one you can even have a
permanent setup. If not you hire an inexpensive VPS in many hosting providers
for $5/month or even less. Let's call this host myhost.
This server needs to have a user account that allows Port Forwarding via SSH,
which is allowed by default in most distributions. To secure the account you can
assign to it the /bin/true shell, so it can login but not execute commands.
In this example, the user will be called tunnel.
root@myhost:~# adduser --no-create-home --shell /bin/true --gecos '' tunnel
Now you ask a person with access to any server in the internal network to
execute the following command and provide him or her with the password for the
tunnel user.
user@server2:~$ ssh tunnel@myhost -N -R 1080
This command will not provide any output and will stay there as if nothing
happens. However, in the background it is using SSH to create a remote
SOCKS proxy in your server, listening
in localhost and port 1080
INTERNET           ║             LAN
                   ║
                   ║
                ╭──╨───╮      ╭───────╮
   ╭─────────◀──┤router├────┬─┤server1│
   │            ╰──╥───╯    │ ╰───────╯
   ▼               ║        │
╭──────╮           ║        │ ╭───────╮
│myhost│           ║        ├─┤server2│
╰──────╯           ║        │ ╰───────╯
                   ║        │
                   ║        │ ╭───────╮
                   ║        ╰─┤server3│
                   ║          ╰───────╯
                   ║
Now in your server you can access the internal network using localhost:1080
as a SOCKS proxy.
The easiest way to do this is to install tsocks.
root@myhost:~# apt install tsocks
Once installed, edit /etc/tsocks.conf like this:
# Remove any "local = 192.168.0.0" or other "local" variable lines
server = localhost
server_type = 5
server_port = 1080
Now you can enable the access to the internal network in one of your server
shells with.
root@myhost:~# . tsocks -on
After this command, you will be able to access any server in the internal
network just like if you were inside the network.
root@myhost:~# ssh root@server3
root@server3:~# exit
root@myhost:~# ssh root@server1
root@server1:~#
I hope you find this trick useful. Keep in mind that once you have this setup
in your end, the other end only needs to execute one command.
Fri, 06 Dec 2019 16:46Checking Access Log Files
[link—standalone]
From time to time you need to check the access log of some of your servers
right? Sometimes you want to find if or why something is wrong and sometimes you
just want to gather some data (to understand if or why something is
wrong).
Here are some neat tools and commands I use to check the access log files of my
servers.
goaccess
I love console based and pretty looking tools and for sure goaccess is one of those.
This tool allows you to see what is going on in your website giving you some
stats and some information about your visitors. There you can see what are
the most requested urls, the amount of visitors per day, the hours where you
get more traffic, referrers, etc.
You can run it with
goaccess -f /var/log/nginx/access.log
And it basically looks like this:
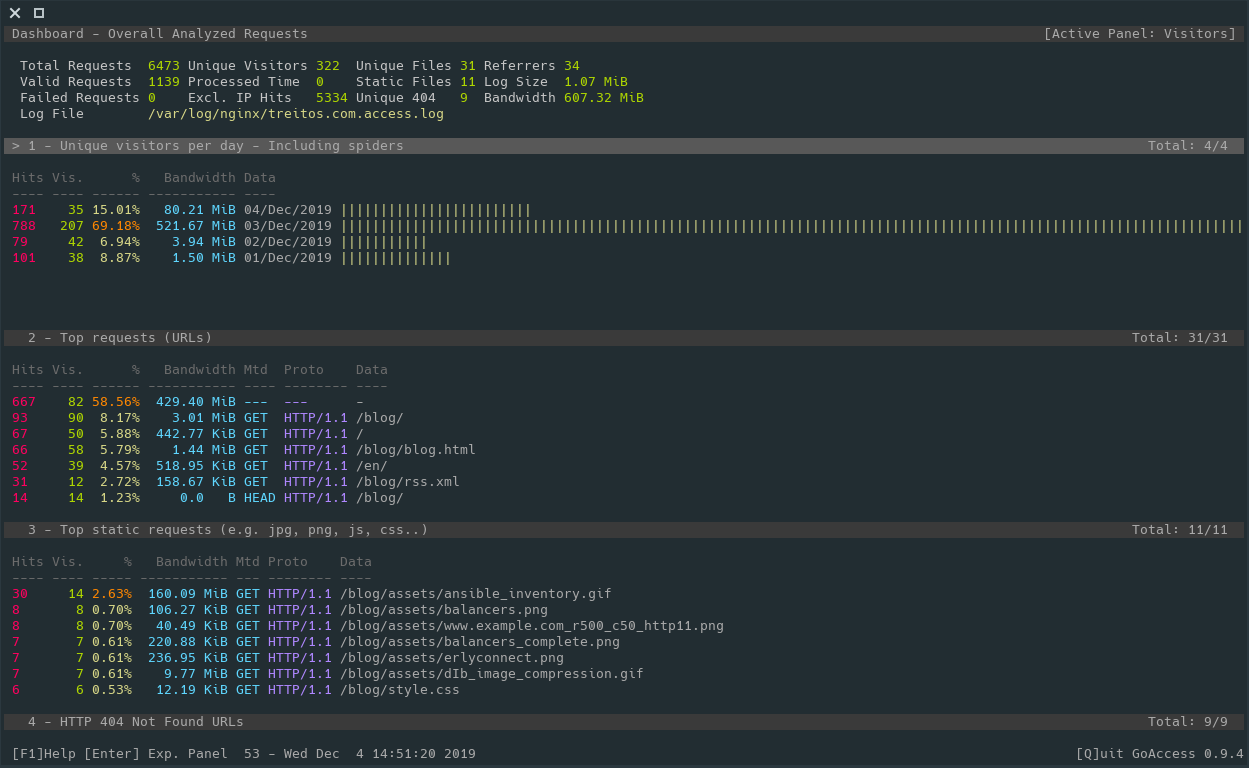
However it also provides an HTML interface so you can periodically generate
a static HTML page to check the stats in an more graphical format.
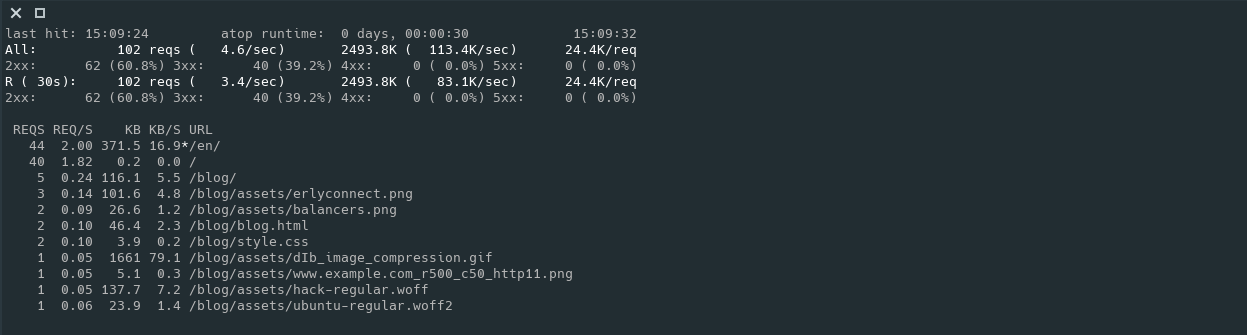
apachetop
The name says it all: it is a top command for apache. However, as it
requires an access.log file as input, you can also use it with nginx as
long as you keep the common log format.
One of the features that I like about this command is that it will show the
current rate of requests per second, averaging both since the command
started and in an specified interval (default 30s). It will also show the
most requested urls and other stats.
You can run it with
apachetop -f /var/log/nginx/access.log
And it looks like this:
grep
Yes... grep and friends help me a lot to find useful information and stats.
Let me show you some examples.
$ zgrep -Poh '" \d{3} ' access.log* | sort | uniq -c | sort -rn

196071 " 200
 30397 " 302
  3928 " 404
   590 " 301
   339 " 304
    48 " 502
    38 " 470
    32 " 499
    27 " 504
    24 " 500
    18 " 400
     9 " 418
     4 " 405
     2 " 206
     1 " 403
$ zgrep -Poh '\d{2}/Nov/2019' access.log* | sort | uniq -c
[ ... ]
1601 21/Nov/2019
1603 22/Nov/2019
1552 23/Nov/2019
1517 24/Nov/2019
1601 25/Nov/2019
1545 26/Nov/2019
1624 27/Nov/2019
1615 28/Nov/2019
1542 29/Nov/2019
1527 30/Nov/2019
$ zgrep -Poh '03/Dec/2019:\d{2}' access.log* | cut -d' ' -f1 | sort | uniq -c
  63 03/Dec/2019:00
  66 03/Dec/2019:01
  61 03/Dec/2019:02
  64 03/Dec/2019:03
  62 03/Dec/2019:04
  65 03/Dec/2019:05
  61 03/Dec/2019:06
  60 03/Dec/2019:07
  73 03/Dec/2019:08
  73 03/Dec/2019:09
  73 03/Dec/2019:10
  64 03/Dec/2019:11
 164 03/Dec/2019:12
 137 03/Dec/2019:13
 135 03/Dec/2019:14
  93 03/Dec/2019:15
 103 03/Dec/2019:16
 195 03/Dec/2019:17
 145 03/Dec/2019:18
 139 03/Dec/2019:19
  94 03/Dec/2019:20
 114 03/Dec/2019:21
 109 03/Dec/2019:22
 106 03/Dec/2019:23
$ zgrep -Poh '.* \[03/Dec/2019.*\] "HEAD ' access.log* | cut -d' ' -f1 | sort | uniq -c | sort -rn
4 54.209.251.246
3 35.247.113.5
3 217.182.175.162
2 3.82.218.185
2 35.230.122.175
2 34.83.11.15
1 96.28.180.117
1 95.216.13.24
1 94.130.53.35
1 91.121.79.122
1 69.113.35.243
1 51.91.13.105
I know what you are thinking: "This guy has no traffic at all" ... and you are
right. This server has almost not traffic.
Jokes aside, I hope you can see that you can make different combinations of the
above commands, or change some parameters to obtain the information you are
looking for in a very easy way.
ansible -o -m shell -a "zgrep -h  '\"GET /public/awesome_85.03.img' /var/log/nginx/public.access.log* | egrep 'ROUTERCOM' | grep '\" 200' | egrep '/Nov/2019' | awk '{ print \$1\" \"\$9 }' | sort | uniq | wc -l" 'frontends:!TRASH' | awk '{sum += $8} END {print sum}'
217
This is based in a real case. It looks in all the frontends servers defined
in the Ansible inventory (that are not in the TRASH group) for successfull
downloads (code 200) using the user agent "ROUTERCOM" during November 2019
of the firmware awesome_85.03.img and then gets the output from ansible and
sums all the values, returning single number of downloads: 217.
Wed, 04 Dec 2019 18:48NGINX Web Application Firewall
[link—standalone]
For a long time I looked for a WAF (Web Application Firewall) for my nginx
installations. As a systems administrator that installs web applications from
developer teams with very different degrees of attention to security, a WAF
is a must in every installation.
Why to use a WAF?
Installing a WAF helps to frustrate attack attempts. It will prevent the
exploitation of some vulnerabilities present in the underlying web application
and also discourage some lazy attackers who will prefer to switch to an easier
target. You might even save some bandwidth from deterring these attacks.
However, a WAF is not a fix for web vulnerabilties so if you
know your web application has security issues, you must fix them. Installing
a WAF will certainly obstruct the exploitation, but in the long run your
website will be compromised.
A WAF for NGINX
There are several options for securing our nginx.
We can use naxsi, however it requires
some "training" to find the rules that we must whitelist and this might be a
long process and it is very specific to each installation. I prefer an easy
configurable WAF that it just works after it is installed.
We can also use mod_securty for nginx,
but we would need to compile it specifically for our installations and take care
of its maintenance each time we update nginx so it is not very practical.
There are some other custom options using ngx_lua but none of them was exactly what I wanted. However, I was inspired by them and I ended up writing my own WAF.
I wanted it to be configurable and have options to whitelist rules and IPs. I also wanted it to be fast, so ngx_lua looked like a great option.
This is why I created nginx_waf: https://github.com/diego-treitos/nginx_waf
I've been using it for more than a year now and it has certainly blocked a ton of attacks, which can be seeing in its log file. I am very happy with the results and I plan to continue to improve it.
Please, feel free to use it and sent questions or requests via the GitHub issue tracker. All the information regarding how to use it and install it is in the repository.
Tue, 03 Dec 2019 13:12Linux Smart Enumeration
[link—standalone]
I've been learing a lot about cyber security during the last couple of years. Reading some books, testing stuff, practicing in platforms like vulnhub or hackthebox, etc. One of the problems I found during the privilege escalation phase, when I gained a shell into a linux machine, is the lack of a tool that finds important security problems that I can exploit to gain further access.
One of the tools I use for local enumeration in linux is LinEnum, which is great and shows a lot of information about the system you are in. However, for me, the feature that I missed was some kind of filtering about the information. A way to see clearly if there is something specially vulnerable or poorly configured in a system. In other words, I wanted some information filtering and blinking arrows pointing towards critical exploitable vulnerabilities.
For this reason I started to see if I could contribute to the LinEnum project adding this feature, but eventually I realized that it was too complex to change LinEnum as it required a heavy code refactoring to add different levels of verbosity. For that reason I ended up coding linux-smart-enumeration, or lse.
With lse, you have several verbosity levels. In the default level (level 0), you basically see the most important information that you can use in a privilege escalation. It will use nice coloring so it is easy to see the different vulnerabilities.
In case you dont see anything important in level 0 verbosity, you can switch to level 1. Here you will see the "important stuff" that might not have been automatically detected in level 0.
Finally you have level 2, that basically dumps everything about the system that this tool gathers.
You can also select exactly what tests to execute, individually or by sections.
Please, check the lse github for more information.
Here is a video of the tool in action so you can see a bit of what it does and how it looks.
Fri, 22 Nov 2019 00:46